| If the chars seem too strange switch to UTF-8 | Если буквы Вам не знакомы поменяйте кодировку на UTF-8 | Prof Gilbert Burnham MD SummaryBackgroundAn excess mortality of nearly 100 000 deaths was reported in Iraq for the period March, 2003–September, 2004, attributed to the invasion of Iraq. Our aim was to update this estimate. MethodsBetween May and July, 2006, we did a national cross-sectional cluster sample survey of mortality in Iraq. 50 clusters were randomly selected from 16 Governorates, with every cluster consisting of 40 households. Information on deaths from these households was gathered. FindingsThree misattributed clusters were excluded from the final analysis; data from 1849 households that contained 12 801 individuals in 47 clusters was gathered. 1474 births and 629 deaths were reported during the observation period. Pre-invasion mortality rates were 5·5 per 1000 people per year (95% CI 4·3–7·1), compared with 13·3 per 1000 people per year (10·9–16·1) in the 40 months post-invasion. We estimate that as of July, 2006, there have been 654 965 (392 979–942 636) excess Iraqi deaths as a consequence of the war, which corresponds to 2·5% of the population in the study area. Of post-invasion deaths, 601 027 (426 369–793 663) were due to violence, the most common cause being gunfire. InterpretationThe number of people dying in Iraq has continued to escalate. The proportion of deaths ascribed to coalition forces has diminished in 2006, although the actual numbers have increased every year. Gunfire remains the most common cause of death, although deaths from car bombing have increased. Back to topIntroductionThere has been widespread concern over the scale of Iraqi deaths after the invasion by the US-led coalition in March, 2003. Various methods have been used to count violent deaths, including hospital death data from the Ministry of Health, mortuary tallies, and media reports.1,2 The best known is the Iraq Body Count, which estimated that, up to September 26, 2006, between 43 491 and 48 283 Iraqis have been killed since the invasion.1 Estimates from the Iraqi Ministry of the Interior were 75% higher than those based on the Iraq Body Count from the same period.2 An Iraqi non-governmental organisation, Iraqiyun, estimated 128 000 deaths from the time of the invasion until July, 2005, by use of various sources, including household interviews.3 The US Department of Defence keeps some records of Iraqi deaths, despite initially denying that they did.4 Recently, Iraqi casualty data from the Multi-National Corps-Iraq (MNC-I) Significant Activities database were released.5 These data estimated the civilian casuality rate at 117 deaths per day between May, 2005, and June, 2006, on the basis of deaths that occurred in events to which the coalition responded. There also have been several surveys that assessed the burden of conflict on the population.6–8 These surveys have predictably produced substantially higher estimates than the passive surveillance reports. Aside from violence, insufficient water supplies, non-functional sewerage, and restricted electricity supply also create health hazards.9,10 A deteriorating health service with insecure access, and the flight of health professionals adds further risks. People displaced by the on-going sectarian violence add to the number of vulnerable individuals. In many conflicts, these indirect causes have accounted for most civilian deaths.11,12 In 2004, we did a survey of 33 randomly selected clusters of 30 households with a mean of eight residents throughout Iraq to determine the excess mortality during the 17·8 months after the 2003 invasion.8 The survey estimated excess mortality of at least 98 000 (95% CI 8000–194 000) after excluding, as an outlier, the high mortality reported in the Falluja cluster. Over half of excess deaths recorded in the 2004 study were from violent causes, and about half of the violent deaths occurred in Falluja. To determine how on-going events in Iraq have affected mortality rates subsequently, we repeated a national household survey between May and July, 2006. We measured deaths from January, 2002, to July, 2006, which included the period of the 2004 survey. Back to topMethodsParticipants and proceduresTo measure mortality we did a national cross-sectional cohort study of deaths from January, 2002, through July, 2006. Household information was gathered about deaths that occurred between January 1, 2002, and the invasion of March 18, 2003, in all households and these data were compared with deaths that occurred from the time of the invasion through to the date of survey. A sample size of 12 000 was calculated to be adequate to identify a doubling of an estimated pre-invasion crude mortality rate of 5·0 per 1000 people per year with 95% confidence and a power of 80%, and was chosen to balance the need for robust data with the level of risk acceptable to field teams. Sampling followed the same approach used in 2004,8 except that selection of survey sites was by random numbers applied to streets or blocks rather than with global positioning units (GPS), since surveyors felt that being seen with a GPS unit could put their lives at risk. The use of GPS units might be seen as targeting an area for air strikes, or that the unit was in reality a remote detonation control. By confining the survey to a cluster of houses close to one another it was felt the benign purpose of the survey would spread quickly by word of mouth among households, thus lessening risk to interviewers. As a first stage of sampling, 50 clusters were selected systematically by Governorate with a population proportional to size approach, on the basis of the 2004 UNDP/Iraqi Ministry of Planning population estimates (table 1). At the second stage of sampling, the Governorate's constituent administrative units were listed by population or estimated population, and location(s) were selected randomly proportionate to population size. The third stage consisted of random selection of a main street within the administrative unit from a list of all main streets. A residential street was then randomly selected from a list of residential streets crossing the main street. On the residential street, houses were numbered and a start household was randomly selected. From this start household, the team proceeded to the adjacent residence until 40 households were surveyed. For this study, a household was defined as a unit that ate together, and had a separate entrance from the street or a separate apartment entrance. 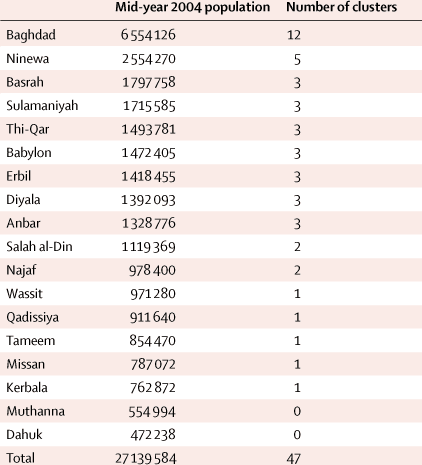
Table 1. Province populations and cluster allocationThe two survey teams each consisted of two female and two male interviewers, with the field manager (RL) serving as supervisor. All were medical doctors with previous survey and community medicine experience and were fluent in English and Arabic. A 2-day training session was held. Decisions on sampling sites were made by the field manager. The interview team were given the responsibility and authority to change to an alternate location if they perceived the level of insecurity or risk to be unacceptable. In every cluster, the numbers of households where no-one was at home or where participation was refused were recorded. In every cluster, queries were made about any household that had been present during the survey period that had ceased to exist because all members had died or left. Empty houses or those that refused to participate were passed over until 40 households had been interviewed in all locations. The survey purpose was explained to the head of household or spouse, and oral consent was obtained. Participants were assured that no unique identifiers would be gathered. No incentives were provided. The survey listed current household members by sex, and asked who had lived in this household on January 1, 2002. The interviewers then asked about births, deaths, and in-migration and out-migration, and confirmed that the reported inflow and exit of residents explained the differences in composition between the start and end of the recall period. Separation of combatant from non-combatant deaths during interviews was not attempted, since such information would probably be concealed by household informants, and to ask about this could put interviewers at risk. Deaths were recorded only if the decedent had lived in the household continuously for 3 months before the event. Additional probing was done to establish the cause and circumstances of deaths to the extent feasible, taking into account family sensitivities. At the conclusion of household interviews where deaths were reported, surveyors requested to see a copy of any death certificate and its presence was recorded. Where differences between the household account and the cause mentioned on the certificate existed, further discussions were sometimes needed to establish the primary cause of death. The study received ethical approval from the Committee on Human Research of the Johns Hopkins Bloomberg School of Public Health, Baltimore, MD, USA, and the School of Medicine, Al Mustansiriya University, Baghdad, Iraq. Statistical analysisData entry and analysis was done with Microsoft Excel, SPSS version 12.0, and STATA version 8. Period mortality rates were calculated on the basis of the mid-interval population and with regression models. Mortality rates and relative risks of mortality were estimated with log-linear regression models in STATA.13 To estimate the relative risk, we used a model that allowed for a baseline rate of mortality and a distinct relative rate for three 14-month intervals post-invasion—March, 2003–April, 2004, May, 2004–May, 2005, and June, 2005–June, 2006. The SE for mortality rates were calculated with robust variance estimation that took into account the correlation between rates of death within the same cluster over time.14 The log-linear regression model assumed that the variation in mortality rates across clusters is proportional to the average mortality rate; to assess the effect of this assumption we also obtained non-parametric CIs by use of bootstrapping.13,15 As an additional sensitivity analysis, we assessed the effect of differences across clusters by extending models to allow the baseline mortality rate to vary by cluster. We estimated the numbers of excess deaths (attributable rates) by subtraction of the predicted values for the pre-war mortality rates from the post-war mortality rates in the three post-invasion periods. Mortality projections with model rates were applied to 2004 mid-year population estimates for Iraq, minus the population of Dahuk and Muthanna, which were not sampled, to ascertain mortality projections.9 Role of the funding sourceMassachusetts Institute of Technology, which was the major funder, had no role in the collection or the analysis of the data, or the preparation of the publication. The Johns Hopkins Center for Refugee and Disaster Response used some general funds to cover research expense. All authors had full access to all the data; the corresponding author had final responsibility to submit for publication. Back to topResultsThe survey was done between May 20 and July 10, 2006. Only 47 of the sought 50 clusters were included in this analysis. On two occasions, miscommunication resulted in clusters not being visited in Muthanna and Dahuk, and instead being included in other Governorates. In Wassit, insecurity caused the team to choose the next nearest population area, in accordance with the study protocol. Later it was discovered that this second site was actually across the boundary in Baghdad Governorate. These three misattributed clusters were therefore excluded, leaving a final sample of 1849 households in 47 randomly selected clusters. In 16 (0·9%) dwellings, residents were absent; 15 (0·8%) households refused to participate. In the few apartment houses visited, the team progressed to the nearest households within the building. One team could typically complete a cluster of 40 households in 1 day. No interviewers died or were injured during the survey. Households where all members were dead or had gone away were reported in only one cluster in Ninewa and these deaths are not included in this report. The 1849 households that completed the survey had 12 801 household members at the time of the survey; thus, the mean household size was 6·9 people. Of the 12 529 residents whose sex was recorded, 6123 (48·9%) were male. The study population at the beginning of the recall period (January 1, 2002) was calculated to be 11 956, and a total of 1474 births and 629 deaths were reported during the study period; age was reported for 610 of 629 deaths, sex reporting was complete. During the survey period there were 129 households (7%) that reported in-migration, and 152 households (8%) reported out-migration. Survey teams asked for death certificates in 545 (87%) reported deaths and these were present in 501 cases. The pattern of deaths in households without death certificates was no different from those with certificates. Of the 629 deaths reported, 547 (87%) were in the post-invasion period (March, 2003, to June, 2006) compared with 82 (13%) in the pre-invasion period (January, 2002, to March, 2003; table 2). Most deaths (n=485; 77%) were in males, and this was true for both periods, but more pronounced in the pre-invasion period (57 of 82 deaths pre-invasion vs 428 of 547 deaths post-invasion). The male-to-female ratio of post-invasion deaths was 3·4 for all deaths, and 9·8 for violent deaths (all deaths: 144 female, 485 male; violent death: 28 female, 274 male). In general, deaths by age group followed the expected J-shaped demographic curve; however, by contrast, most deaths in males were in the middle age groups (figure 1). 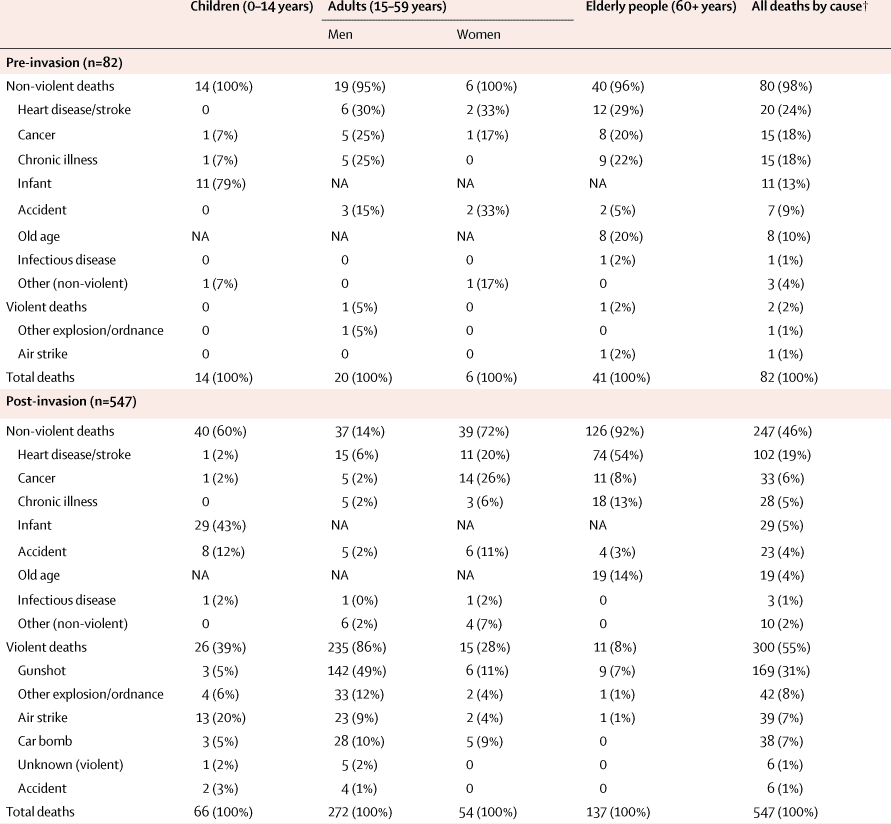
Data are number (% of deaths within age group). NA=not applicable. *Age was reported for 610 of 629 deaths that occurred; sex reporting was complete. †Includes deaths with unknown age. Causes of death were much the same between the sexes both pre-invasion and post-invasion for children (p=0·342 pre-invasion and p=0·189 post-invasion) and elderly individuals (p=0·215 pre-invasion and p=0·483 post-invasion). Causes of death were much the same by sex in adults pre-invasion (p=0·297), but significantly different post-invasion (p<0·0001). Table 2. Pre-invasion and post-invasion deaths by age and cause (n=629)*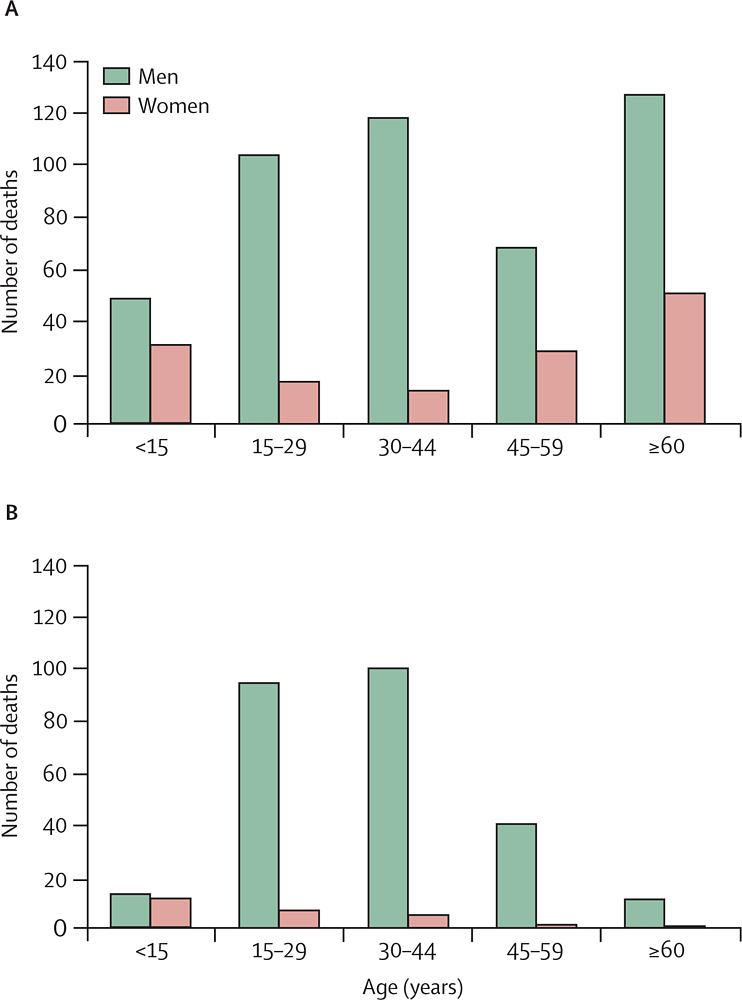 Figure 1. Deaths where age and sex known since start of study period(A) All deaths (n=610). (B) Violent deaths (n=287). The crude mortality rate in the pre-invasion period was 5·5 per 1000 people per year (95% CI 4·3–7·1) and for the overall post-invasion period was 13·3 per 1000 people per year (10·9–16·1; table 3). A four-fold increase in the crude mortality rate was recorded during the study period, with a high of 19·8 per 1000 people per year (14·6–26·7) between June, 2005, and June, 2006 (figure 2 and table 3). 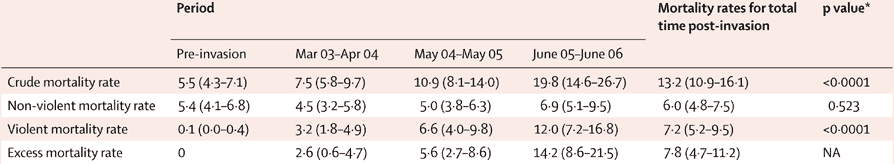 Table 3. Mortality rates by time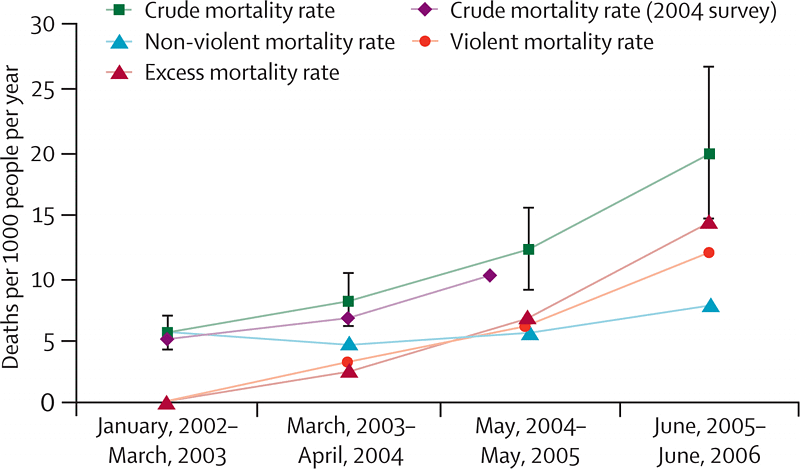 Figure 2. Mortality rates, 2002–06
Post-invasion excess mortality rates showed much the same escalating trend, rising from 2·6 per 1000 people per year (0·6–4·7) above the baseline rate in 2003 to 14·2 per 1000 people per year (8·6–21·5) in 2006 (figure 2 and table 3). Excess mortality is attributed mainly to an increase in the violent death rate; however, an increase in the non-violent death rate was noted in the later part of the post-invasion period (2005–06). The post-invasion non-violent excess mortality rate was 0·7 per 1000 people per year (−1·2 to 3·0). Of the 302 conflict-related violent deaths reported, 300 (99%) were post-invasion (table 4). An increase in violent death rates was seen in the post-invasion period (figure 2). Analysis for trend showed that this rate for violent deaths increased significantly in every period after the invasion (p<0·0001) compared with the pre-invasion period. 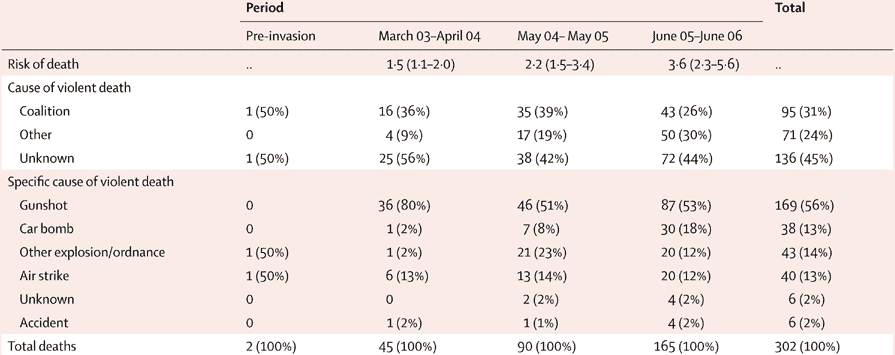 Table 4. Violent deaths by cause and timeOf the 302 violent deaths, 274 (91%) were of men, and within this group, deaths concentrated in the 15–29 and 30–44 year old age groups (figure 1). Most violent deaths were due to gunshots (56%); air strikes, car bombs, and other explosions/ordnance each accounted for 13–14% of violent deaths. The number of deaths from gunshots increased consistently over the post-invasion period, and a sharp increase in deaths from car bombs was noted in 2006. Violent deaths that were directly attributed to coalition forces or to air strikes were classified as coalition violent deaths. In many other cases the responsible party was not known, or the households were hesitant to specifically identify them. Deaths attributable to the coalition accounted for 31% (95% CI 26–37) of post-invasion violent deaths. The proportion of violent deaths attributable to the coalition was much the same across periods (p=0·058). However, the actual number of violent deaths, including those that resulted from coalition forces, increased every year after the invasion. Deaths in men of military age, defined as 15–44 years of age, were disproportionately high and accounted for 59% (52–65) of post-invasion violent deaths, despite this subgroup accounting for only 24·4% of the Iraqi population.16 No difference in the proportion of violent deaths in men of military age was noted between deaths attributed to the coalition or other/unknown sources (p=0·168). Mortality rates by Governorate are shown in figure 3. 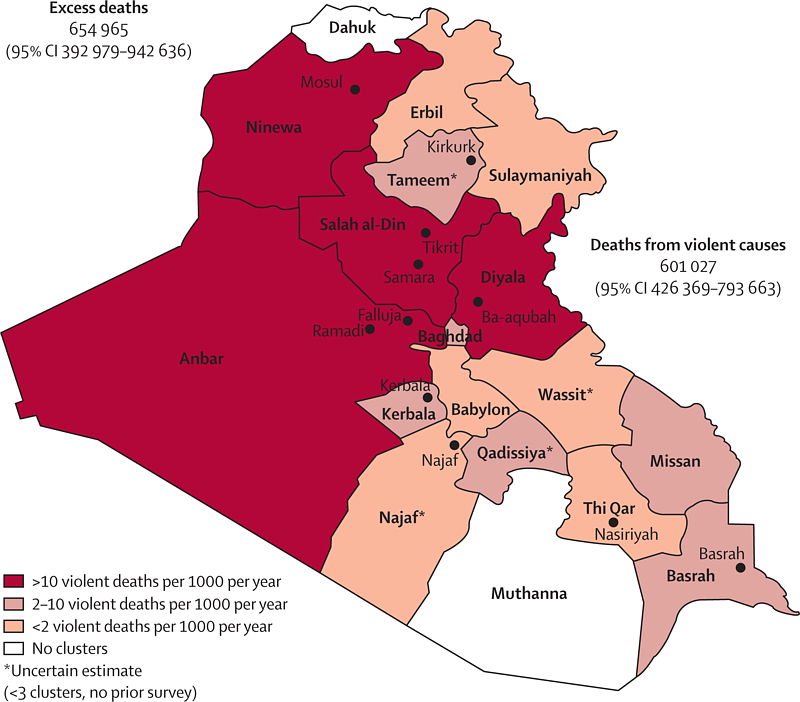 Figure 3. Death rates due to violent causes per GovernorateMortality rates in Governorates with fewer than three clusters were confirmed with 2004 survey data; estimates for provinces with fewer than three clusters that could not be confirmed are potentially uncertain due to the small sample size. Of the 327 non-violent deaths that were reported, 80 (24%) occurred pre-invasion and 247 (76%) occurred post-invasion (table 2). Non-violent mortality rates before and after invasion are shown in table 3. The mortality rates from non-violent causes were essentially unchanged until the first 6 months of 2006, at which point they increased by almost two deaths per 1000 people per year; however, this increase was not significant. The male-to-female ratio of non-violent deaths was 1·8 (211 male vs 116 female deaths; p<0·0001). 17% of non-violent deaths occurred in those aged under 15 years, 32% in 15–59 year olds, and 52% in those over 60 years. Non-violent deaths by time, age, and cause are described in table 2. Cardiovascular conditions were the main cause of non-violent death and accounted for 37% of non-violent deaths over the entire study period. Other notable sources of non-violent mortality included cancer (14%), chronic illnesses (13%), infant deaths (12%), accidents (11%), and old age (8%). Causes of non-violent deaths were much the same both pre-invasion and post-invasion (p=0·290). We estimate that between March 18, 2003, and June, 2006, an additional 654 965 (392 979–942 636) Iraqis have died above what would have been expected on the basis of the pre-invasion crude mortality rate as a consequence of the coalition invasion. Of these deaths, we estimate that 601 027 (426 369–793 663) were due to violence. Back to topDiscussionWe estimate that, as a consequence of the coalition invasion of March 18, 2003, about 655 000 Iraqis have died above the number that would be expected in a non-conflict situation, which is equivalent to about 2·5% of the population in the study area. About 601 000 of these excess deaths were due to violent causes. Our estimate of the post-invasion crude mortality rate represents a doubling of the baseline mortality rate, which, by the Sphere standards, constitutes a humanitarian emergency.17 Our estimate of the pre-invasion crude or all-cause mortality rate is in close agreement with other sources.18,19 The post-invasion crude mortality rate increased significantly from pre-invasion figures, and showed a rising trend. The increasing number of violent deaths follows trends of bodies counted by mortuaries, as well as those reported in the media and by the Iraq Body Count.1,5,20 Application of the mortality rates reported here to the period of the 2004 survey8 gives an estimate of 112 000 (69 000–155 000) excess deaths in Iraq in that period. Thus, the data presented here validates our 2004 study, which conservatively estimated an excess mortality of nearly 100 000 as of September, 2004. Our estimate of excess deaths is far higher than those reported in Iraq through passive surveillance measures.1,5 This discrepancy is not unexpected. Data from passive surveillance are rarely complete, even in stable circumstances, and are even less complete during conflict, when access is restricted and fatal events could be intentionally hidden. Aside from Bosnia,21 we can find no conflict situation where passive surveillance recorded more than 20% of the deaths measured by population-based methods. In several outbreaks, disease and death recorded by facility-based methods underestimated events by a factor of ten or more when compared with population-based estimates.11,22–25 Between 1960 and 1990, newspaper accounts of political deaths in Guatemala correctly reported over 50% of deaths in years of low violence but less than 5% in years of highest violence.26 Nevertheless, surveillance tallies are important in monitoring trends over time and in the provision of individual data, and these data track closely with our own findings (figure 4). 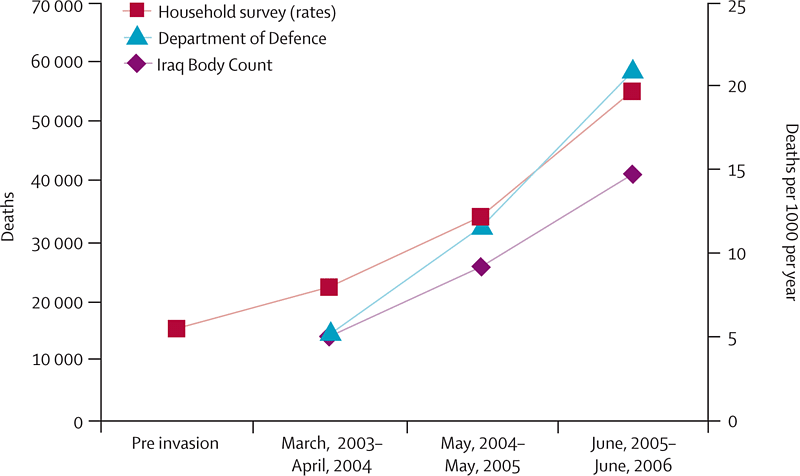 Figure 4. Trends in number of deaths reported by the Iraq Body Count and the MultiNational Corps-Iraq and the mortality rates found by this studyMortality rates from violent causes have increased every year post-invasion. By mid-year 2006, 91 violent deaths had occurred in 6 months, compared with 27 post-invasion in 2003 and 77 in 2004, and 105 for 2005, suggesting that violence has escalated substantially. The attributed cause of these deaths has also changed with time. Our data show that gunfire is the major cause of death in Iraq, accounting for about half of all violent deaths. Deaths from air strikes were less commonly reported in 2006 than in 2003–04, but deaths from car explosions have increased since late 2005. The proportion of violent deaths attributed to coalition forces might have peaked in 2004; however, the actual number of Iraqi deaths attributed to coalition forces increased steadily through 2005. Deaths were not classified as being due to coalition forces if households had any uncertainty about the responsible party; consequently, the number of deaths and the proportion of violent deaths attributable to coalition forces could be conservative estimates. Distinguishing criminal murders from anti-coalition force actions was not possible in this survey. Across Iraq, deaths and injuries from violent causes were concentrated in adolescent to middle age men. Although some were probably combatants, a number of factors would expose this group to more risk—eg, life style, automobile travel, and employment outside the home. The circumstances of a number of deaths from gunshots suggest assassinations or executions. Coalition forces have been reported as targeting all men of military age.27,28 From January, 2002, until the invasion in 2003, virtually all deaths in Iraq were from non-violent causes. The main causes of non-violent deaths were much the same as the leading causes of hospital deaths reported by the Ministry of Health in 2004 and 2005 (unpublished data). Death rates from non-violent causes remained essentially unchanged from pre-invasion levels until 2006, when they rose by 2·0 deaths per 1000 per year above the pre-invasion baseline, an increase that was not significant. We are unsure of the reason for the observed change in sex ratio of adults aged 15–59 years dying from non-violent causes between pre-invasion and post-invasion periods (table 2), or why deaths from cardiovascular causes rose after the invasion. All surveys have potential for error and bias. The extreme insecurity during this survey could have introduced bias by restricting the size of teams, the number of supervisors, and the length of time that could be prudently spent in all locations, which in turn affected the size and nature of questionnaires. Further, calling back to households not available on the initial visit was felt to be too dangerous. Families, especially in households with combatants killed, could have hidden deaths. Under-reporting of infant deaths is a wide-spread concern in surveys of this type.29,30 Entire households could have been killed, leading to a survivor bias. The population data used for cluster selection were at least 2 years old, and if populations subsequently migrated from areas of high mortality to those with low mortality, the sample might have over-represented the high-mortality areas. The miscommunication that resulted in no clusters being interviewed in Duhuk and Muthanna resulted in our assuming that no excess deaths occurred in those provinces (with 5% of the population), which probably resulted in an underestimate of total deaths. Families could have reported deaths that did not occur, although this seems unlikely, since most reported deaths could be corroborated with a certificate. However, certificates might not be issued for young children, and in some places death certificates had stopped being issued; our 92% confirmation rate was therefore deemed to be reasonable. Large-scale migration out of Iraq could affect our death estimates by decreasing population size. Out-migration could introduce inaccuracies if such a process took place predominantly in households with either high or low violent death history. Internal population movement would be less likely to affect results appreciably. However, the number of individual households with in-migration was much the same as those with out-migration in our survey. Although interviewers used a robust process for identifying clusters, the potential exists for interviewers to be drawn to especially affected houses through conscious or unconscious processes. Although evidence of this bias does not exist, its potential cannot be dismissed.31 Furthermore, families might have misclassified information about the circumstances of death. Deaths could have been over or under-attributed to coalition forces on a consistent basis. The numbers of non-violent deaths were low, thus, estimation of trends with confidence was difficult. Not sampling two of the Governorates could have underestimated the total number of deaths, although these areas were generally known as low-violence Governorates. Finally, the sex of individuals who had died might not have been accurately reported by households. Female deaths could have been under-reported, or there might have been discomfort felt in reporting certain male deaths. The striking similarity between the 2004 and 2006 estimates of pre-war mortality diminishes concerns about people's ability to recall deaths accurately over a 4-year period. Likewise, the similar patterns of mortality over time documented in our survey and by other sources corroborate our findings about the trends in mortality over time.1,5,32 In Iraq, as with other conflicts, civilians bear the consequences of warfare. In the Vietnam war, 3 million civilians died; in the Democratic Republic of the Congo, conflict has been responsible for 3·8 million deaths; and an estimated 200 000 of a total population of 800 000 died in conflict in East Timor.33–35 Recent estimates are that 200 000 people have died in Darfur over the past 31 months.36 We estimate that almost 655 000 people—2·5% of the population in the study area—have died in Iraq. Although such death rates might be common in times of war, the combination of a long duration and tens of millions of people affected has made this the deadliest international conflict of the 21st century, and should be of grave concern to everyone. At the conclusion of our 2004 study8 we urged that an independent body assess the excess mortality that we saw in Iraq. This has not happened. We continue to believe that an independent international body to monitor compliance with the Geneva Conventions and other humanitarian standards in conflict is urgently needed. With reliable data, those voices that speak out for civilians trapped in conflict might be able to lessen the tragic human cost of future wars. Back to topContributors G Burnham, as principal investigator, was involved in the study design and ethical approval, took part in the analysis and interpretation of results, and led the writing of the paper. R Lafta managed the field survey in Iraq, participated in the study design and the analysis, interpretation, and preparation of the manuscript. S Doocy managed the study data and was involved in the analysis, interpretation, and the writing of the manuscript. L Roberts instigated the study and assisted with the analysis and interpretation of the data and the writing of the manuscript. Conflict of interest statement We declare that we have no conflict of interest. Acknowledgments We acknowledge the assistance of Scott Zeger in the study design and analysis, Elizabeth Johnson in the statistical analysis, Courtland Robinson and Stan Becker who helped with the demographic analysis, and Elizabeth Dzeng who assisted with data management. We express our deepest admiration for the dedicated Iraqi data collectors who have asked not to be identified. Funding was provided by the Massachusetts Institute of Technology and the Center for Refugee and Disaster Response of the Johns Hopkins Bloomberg School of Public Health. Back to topReferences1. Iraq Body Count. Iraq Body Count 2. O'Hanlon ME, Kamons A. Iraq index: tracking variables of reconstruction and security in post-Saddam Iraq. Washington, DC: The Brookings Institution, 2006:. 3. NGO Coordination Committee in Iraq. Iraq emergency situation, final report. Baghdad: NGO Coordination Committee in Iraq, 2006:. 4. Tavernise S. US quietly issues estimate of Iraqi civilian casualties. New York Times Oct 30 2005; . 5. Department of Defence. Measuring stability and security in Iraq. Washington: Department of Defense, 2006:. 6. Janabi A. Iraqi group: civilian toll over 37,000 7. UN Development Programme. Iraq living conditions survey 2004 8. Roberts L, Lafta R, Garfield R, Khudhairi J, Burnham G. Mortality before and after the 2003 invasion of Iraq: cluster sample survey. Lancet 2004; 364: 1857-1864. Abstract | Full Text | PDF (252 KB) | CrossRef 9. UN Development Programme. Iraq Ministry of Planning and Development Cooperation. Iraq 2004 living conditions survey, vol 1: tabulation report. New York: UN Development Programme, 2005:. 10. Glanz J. Iraq utilities are falling short of prewar performance. New York Times Feb 9 2006; . 11. Roberts L, Hale C, Belyakdoumi F, et al. Mortality in eastern Democratic Republic of Congo. New York: International Rescue Committee, 2001:. 12. Sapir DG, Gomez VT. Angola: the human impact of war. Brussels: Université catholique de Louvain, 2006:. 13. McCullagh P, Nelder J. Generalized linear models. London: Chapman and Hall, 1989:. 14. Diggle PJ, Heagerty P, Liang KY, Zeger SL. The analysis of longitudinal data. Oxford: Oxford University Press, 2002:. 15. Efron B. Bootstrap methods: another look at the jackknife. Ann Stat 1979; 7: 1-26. 16. US Census Bureau. IDB population pyramids 17. Sphere Project. Humanitarian charter and minimum standards in disaster response. Geneva: Sphere Project, 2004:. 18. CIA 2003 Factbook entry for Iraq 19. US Agency for International Health and US Census Bureau. Global population profile: 2002. Washington, DC: US Census Bureau, 2004:. 20. BBC. Iraq violence: facts and figures 21. Kuzman M, Tomic B, Stevanovic R, et al. Fatalities in the war in Croatia, 1991 and 1992. Underlying and external causes of death. JAMA 1993; 270: 626-628. Abstract | Full Text | PDF (110 KB) | MEDLINE 22. Spiegel PB, Salama P. War and mortality in Kosovo, 1998–99: an epidemiological testimony. Lancet 2000; 355: 2204-2209. Abstract | Full Text | PDF (90 KB) | MEDLINE | CrossRef 23. Malfait P, Moren A, Dillon JC, et al. An outbreak of pellagra related to changes in dietary niacin among Mozambican refugees in Malawi. Int J Epidemiol 1993; 22: 504-511. Full Text | PDF (55 KB) | MEDLINE 24. Roberts L, Despines M. Mortality in the Democratic Republic of the Congo. Lancet 1999; 353: 2249-2250. Full Text | PDF (44 KB) | MEDLINE | CrossRef 25. Goma Epidemiology Group. Public health impact of Rwandan refugee crisis: what happened in Goma, Zaire, in July, 1994?. Lancet 1995; 345: 339-344. Abstract | Full Text | PDF (641 KB) | MEDLINE | CrossRef 26. Ball P, Kobrak P, Spirer HF. State violence in Guatemala, 1960–1996: a quantitative reflection. Washington, DC: AAAS, 1999:. 27. Regan T. New questions about US military's aggression in Iraq. Christian Science Monitor July 24 2006; . 28. Caldwell AA. Soldier's lawyers ask for new hearing. Washington Post Sept 12 2006; . 29. Becker SR, Diop F, Thornton JN. Infant and child mortality in two counties of Liberia: results of a survey in 1988 and trends since 1984. Int J Epidemiol 1993; 22: S56-S63. Abstract | Full Text | PDF (252 KB) 30. Taylor WR, Chahnazarian A, Weinman J, et al. Mortality and use of health services surveys in rural Zaire. Int J Epidemiol 1993; 22: S15-S19. Abstract | Full Text | PDF (252 KB) 31. Zaidi S. Child mortality in Iraq. Lancet 1997; 350: 1105. Full Text | PDF (147 KB) | MEDLINE | CrossRef 32. Knickmeyer E. Body count in Baghdad nearly triples. Washington Post Sept 8 2006; . 33. Allukian M, Atwood PL. Public health and the Vietnam war In: Levy BS, Sidel VW, eds. War and public health. Washington, DC: American Public Health Association, 2000:. 34. Coghlan B, Brennan RJ, Ngoy P, et al. Mortality in the Democratic Republic of Congo: a nationwide survey. Lancet 2006; 367: 44-51. Abstract | Full Text | PDF (206 KB) | CrossRef 35. CNN. US approved E. Timor invasion: documents 36. Hagan J, Palloni A. Death in Darfur. Science 2006; 313: 1578-1579. Abstract | Full Text | PDF (110 KB) Back to topAffiliations
a. Johns Hopkins Bloomberg School of Public Health, Baltimore, MD, USA b. School of Medicine, Al Mustansiriya University, Baghdad, Iraq
Ещё о военных потерях + хотелось бы прочитать такую статью о Чечне | ещё об Ираке | |
||||||

